Introduction
Studies on airfoils are the subject of interest for many designers over the decades. Even though, numerical prediction of the flow around the airfoil still remains a challenging task. Accurate results, lift and drag forces are very difficult to predict.
In this article we will demonstrate that SimFlow is a comprehensive CFD tool that allows not only easy way of modelling, but most importantly very accurate modelling of the airfoils. As the test case NACA 0012 wing profile was chosen. What is important, high quality experimental data are available, done by NASA ([NASA Langley, 1988]).
In this paper we will compare CFD 2D simulation results to test data done for Reynolds number \(Re=6000000\) at \(Ma=0.15\) proving SimFlow high reliability in predictions of external flows.
NACA Airfoils
The National Advisory Committee for Aeronautics (NACA) was a U.S. federal agency, founded in order to promote aeronautical research ([NACA - Wikipedia]). In the 1960s the agency was dissolved and transferred to the newly created National Aeronautics and Space Administration (NASA). NACA created a set of recommendations on the airfoil design, releasing many airfoils shapes, among which we can find NACA 0012 profile. The four digits in the name are parameters that characterise the cross-section of the airfoil:
- The first digit describes the maximum camber as a percentage of the chord length
- The second digit describes the distance of the maximum camber from the airfoil leading edge in tenths of a chord.
- The last two digits describe the maximum thickness of the airfoil as a percentage of the chord.
NACA 0012 is the symmetrical profile without the camber which is described by the following equation:
and its shape is plotted in Figure 1.

NACA 0012 Experimental data
Experimental data are available for validation of NACA 0012. However, it should be noted that fully two-dimensional experiments are very difficult to be conducted. The airfoil was tested at many different angles of attack approaching the stall conditions, which are never 2D in its nature.
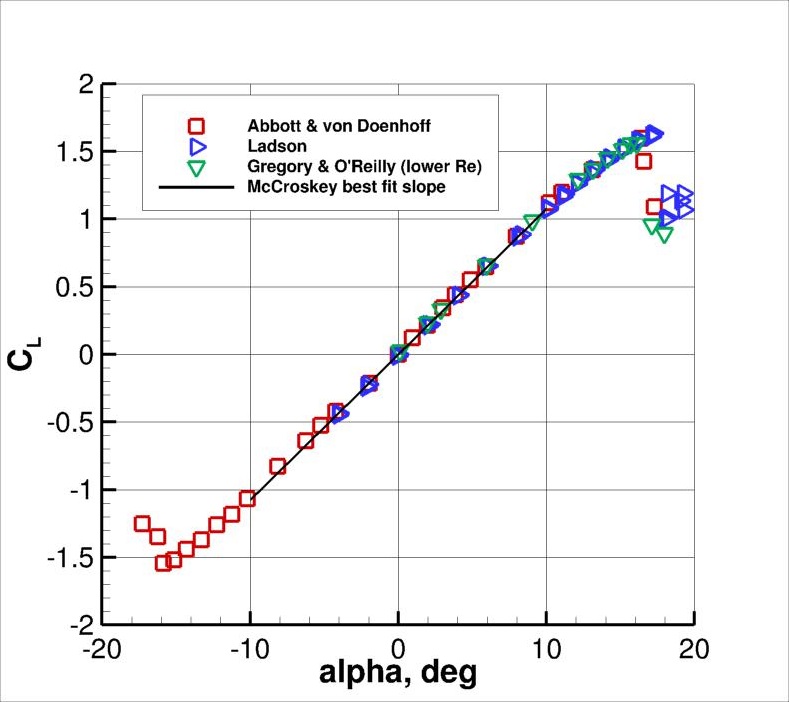
Example of experimental results for \(Re=6000000\) are provided in Figure 2. The reader will notice that some discrepancies occur between different data near the stall. In this study we will compare the simulation results to the [Ladson] experimental data, which are recognized as the most appropriate for comparison with fully turbulent flows.
It is also worth mentioning that the experimental results were conducted at Mach number \(Ma = 0.15\) and therefore the flow is considered incompressible.
Airfoil Mesh
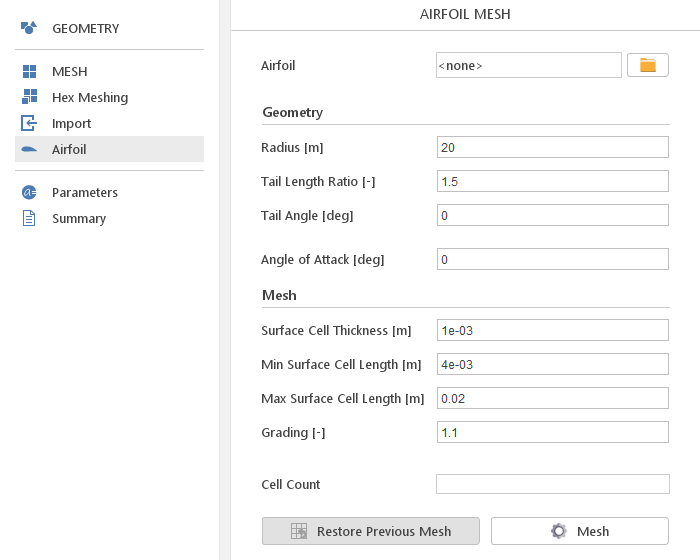
SimFlow contains a very convenient and easy to use Airfoil module that allows fast meshing of airfoils by entering just a few parameters related to the domain size and mesh refinement - Figure 3.
With the Airfoil module, meshing and the model definition becomes very fast which allows the User to investigate large number of airfoil shapes and flow conditions in short time, with minimum effort spent for model preparation.
In the following work we would like to compare SimFlow results with experimental data and results obtained from other CFD codes used by NASA.
Therefore, in order to provide the most reliable comparison between CFD codes we will use the mesh published by NASA ([Grids - NACA 0012 Airfoil Case]).
NASA offers three families of meshes, all with farfield extend of 500c (c - chord):
- Family I: trailing edge spacing = 0.000125 c
- Family II: trailing edge spacing = 0.0000125 c (10 x finer than Family I)
- Family III: trailing edge spacing = 0.0000375 c (3.3333 x finer than Family I, and 3 x coarser than Family II)
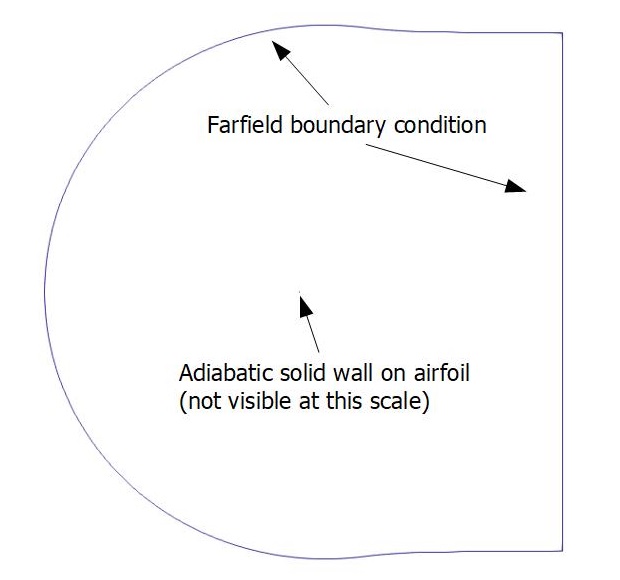
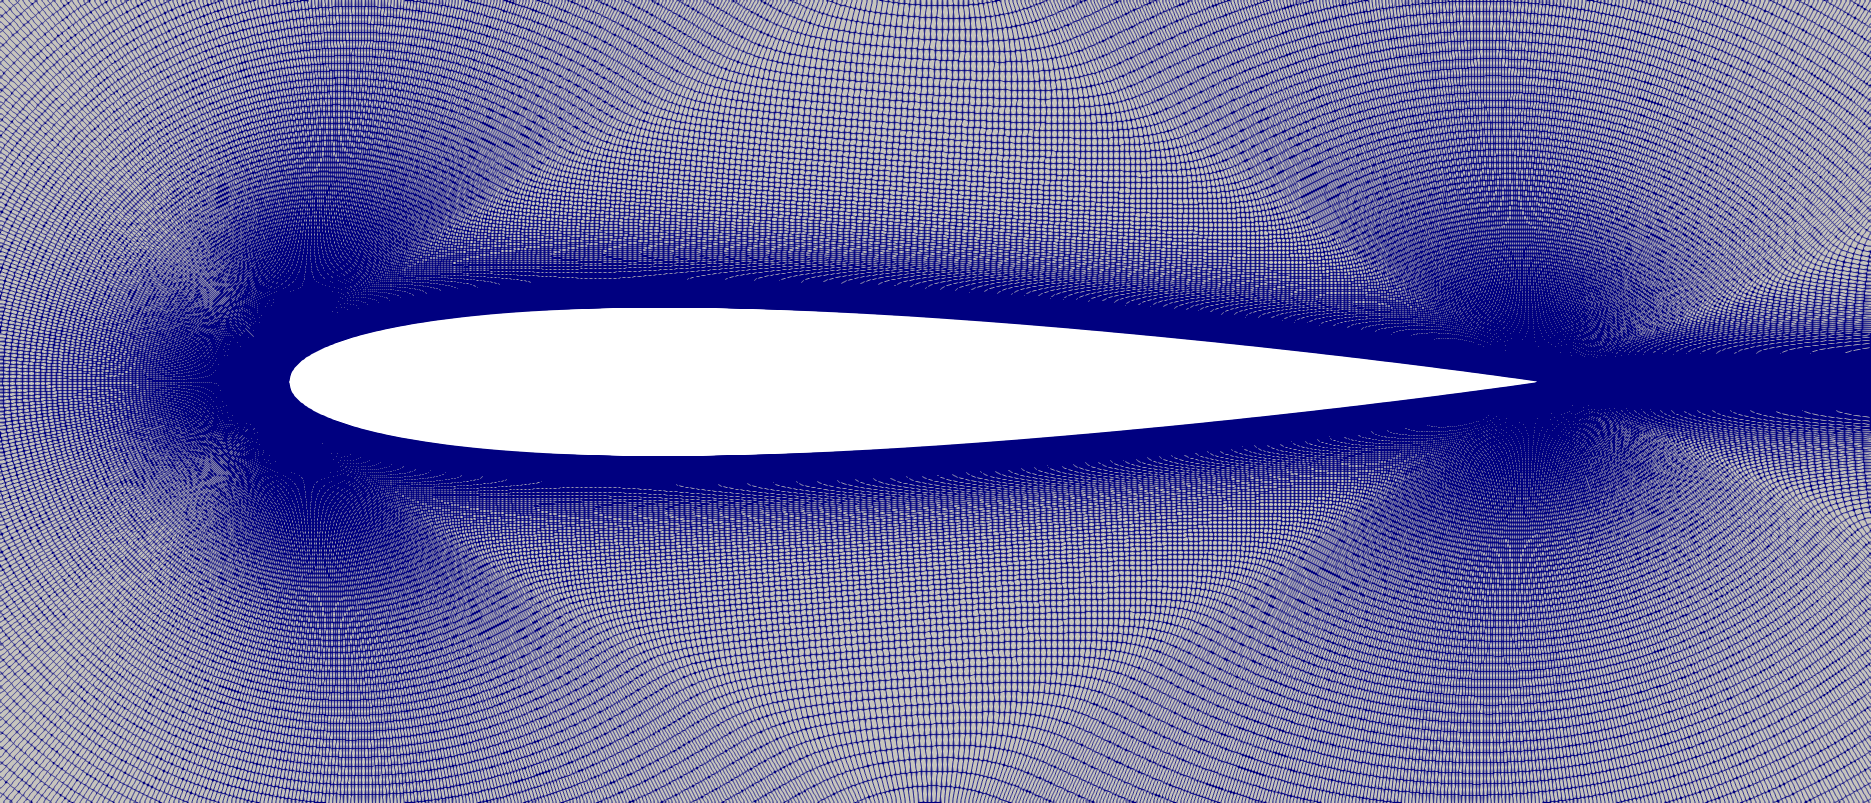
The topology is a so-called "C-grid", with the grid wrapping around the airfoil from downstream farfield, around the lower surface to the upper, then back to the downstream farfield again. For Family I and II there are 7 nested grids with different spacing. For this study we selected Family II mesh with spacing 897x257, resulting in 917 000 elements. The \(y^+\) values are smaller than \(0.1\). The details of the domain and mesh are presented in Figure 4 and Figure 5.
NACA 0012 Model setup
The simulation of the 2D flow around NACA 0012 airfoil was carried out at \(Re=6000000\) (based on chord \(c = 1 \, m\)). The speed of sound was evaluated at \(347 \, \frac{m}{s}\), therefore based on required Mach number \(0.15\), free stream velocity was set to \(52.08 \, \frac{m}{s}\). The angle of attack (AoA) was defined for \(0^o\), \(5^o\), \(10^o\) and \(15^o\).
Steady-state, incompressible simulation was conducted in SimFlow. For this purpose we have used a solver simpleFoam, that uses the Semi-Implicit Method for Pressure Linked Equations (SIMPLE) algorithm for solving momentum equations.
The simulation is restricted to incompressible flow. Therefore, fluid can be described only by kinematic viscosity \(\nu=8.68 \cdot 10^{-6} \frac{m^2}{s}\).
Turbulence was modeled using \(k{-}\omega \; SST\) model with Low Re wall function applied at airfoil.
At this point we would like to mention that CFD codes validated by NASA were density-based. solvers. However, since we are working with small Mach number \(Ma=0.15\), the influence of compressibility is small.
Boundary conditions are summarized in Table 1 below:
| Farfield | Airfoil | |
|---|---|---|
\(U\) | Free stream velocity | No-slip |
\(p\) | Free stream pressure | zeroGradient |
\(k\) | Free stream | fixedValue |
\(\omega\) | Free stream | StandardWallFunction |
Free stream values for \(k\) and \(\omega\) were calculated based on free stream velocity, turbulent intensity \(5\%\) and turbulent length scale \(0.07\,m\).
Both, momentum and turbulence transport equations were discretized using Linear Upwind second order accuracy scheme.
GAMG linear solver was used for pressure and PBiCGStab with DILU preconditioner for velocity and turbulence. Very small value of tolerance was used for all equation, at the level of 1e-10 for pressure and 1e-20 for velocity and turbulence.
It is also worth noting that once the solution was achieved for lower AoA, it was mapped for higher angles.
SimFlow allows plotting the residuals and selected monitors on-the-run. In this case we concluded that solution is converged when residuals were at the level 1e-05 and monitored lift coefficient(Cl) and drag coefficient(CD) values show no more variation.
NACA 0012 Results - Lift, Drag & Pressure Coefficient
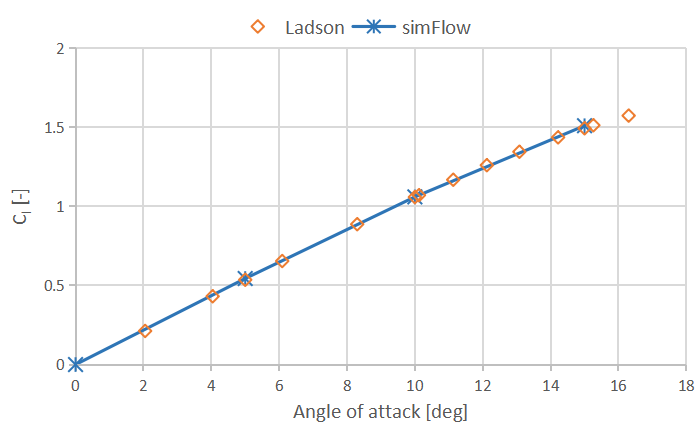
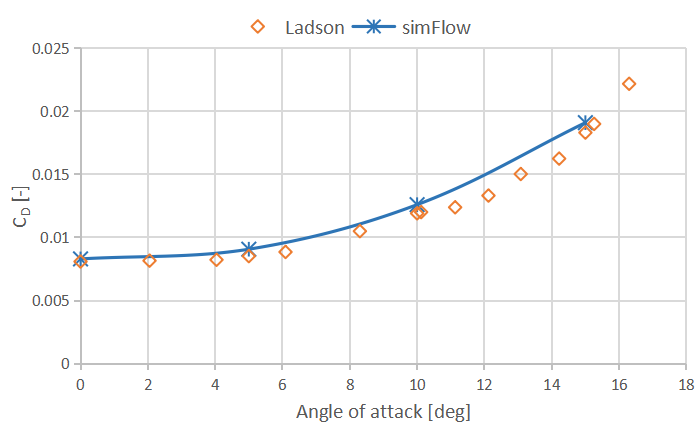
The results obtained using SimFlow are presented in the form of Table 2 and Table 3, and plots showing lift coefficients \(C_l\) and drag coefficients \(C_D\). In the table we put information from the experimental data for the selected AoA but also results from other CFD codes validated by NASA.
| CODE | \(C_l \; (AoA=0^o)\) | \(C_l \; (AoA=5^o)\) | \(C_l \; (AoA=10^o)\) | \(C_l \; (AoA=15^o)\) |
|---|---|---|---|---|
Experiment Ladson | \(-0.00724\) | \(0.536\) | \(1.057\) | \(1.49\) |
SimFlow | \(\sim 0\) | \(0.544\) | \(1.060\) | \(1.51\) |
CFL3D (NASA) | \(\sim 0\) | \(N/A\) | \(1.078\) | \(1.51\) |
FUN3D (NASA) | \(\sim 0\) | \(N/A\) | \(1.084\) | \(1.51\) |
NTS (NASA) | \(\sim 0\) | \(N/A\) | \(1.077\) | \(1.51\) |
| CODE | \(C_D \; (AoA=0^o)\) | \(C_D \; (AoA=5^o)\) | \(C_D \; (AoA=10^o)\) | \(C_D \; (AoA=15^o)\) |
|---|---|---|---|---|
Experiment Ladson | \(0.00809\) | \(0.00852\) | \(0.0119\) | \(0.0183\) |
SimFlow | \(0.00830\) | \(0.00907\) | \(0.0126\) | \(0.0191\) |
CFL3D (NASA) | \(0.00809\) | \(N/A\) | \(0.0124\) | \(0.0222\) |
FUN3D (NASA) | \(0.00808\) | \(N/A\) | \(0.0125\) | \(0.0228\) |
NTS (NASA) | \(0.00809\) | \(N/A\) | \(0.0125\) | \(0.0219\) |
It should be noted that the difference between experimental data by [Ladson] and SimFlow results are not larger that \(2\%\) for lift coefficient \(C_l\) and \(5\%\) for drag coefficient \(C_D\).
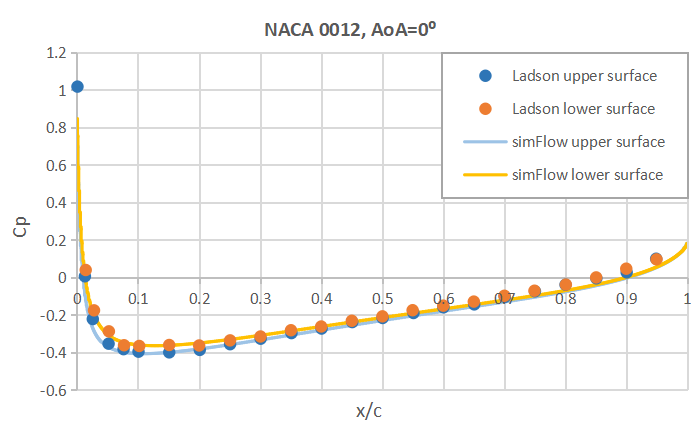
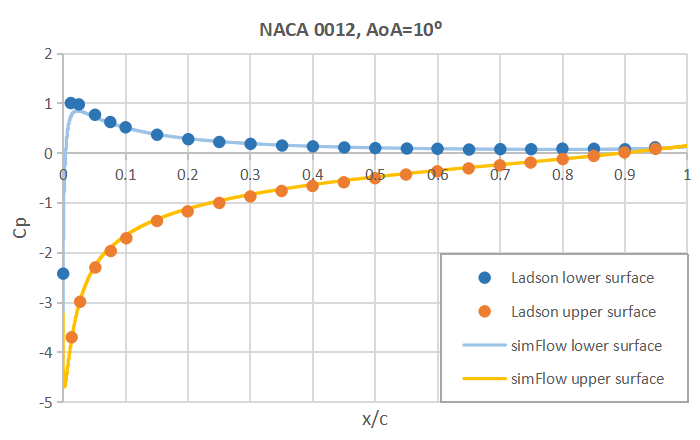
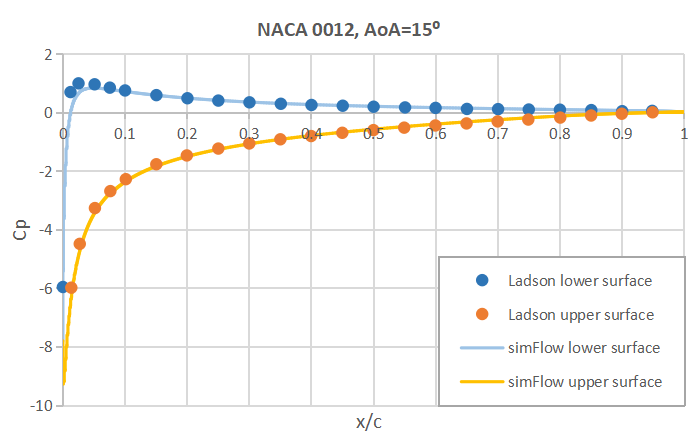
Also the Cp plot versus x/c shows very good agreement with the experimental data. Here we plotted the results for \(AoA=0^o\), \(AoA=10^o\) and \(AoA=15^o\).
Summary
SimFlow was used to simulate 2D external flow around NACA 0012 airfoil and predict lift and drag. The performance was evaluated against the available test data and simulation results from other CFD codes, provided by NASA. It was proven that SimFlow is capable of predicting with high accuracy lift and drag forces with difference less than \(1\%\) for \(C_l\) and \(5\%\) for \(C_D\).
Literature
- [NASA Langley, 1988] https://turbmodels.larc.nasa.gov/naca0012_val.html
- [Grids - NACA 0012 Airfoil Case] https://turbmodels.larc.nasa.gov/naca0012numerics_grids.html
- [2D NACA 0012 Airfoil SSTm Model Results] https://turbmodels.larc.nasa.gov/naca0012_val_sst.html
- [NACA - Wikipedia] https://en.wikipedia.org/wiki/National_Advisory_Committee_for_Aeronautics
- [Ladson] Ladson, C. L., "Effects of Independent Variation of Mach and Reynolds Numbers on the Low-Speed Aerodynamic Characteristics of the NACA 0012 Airfoil Section"