
Introduction
What is CFD
Computational Fluid Dynamics is a branch of fluid mechanics that uses applied mathematics and numerical methods to solve conservation equations which describes physics of a fluid flow.
Computers with CFD software are used to perform the calculations required to simulate how the fluid flows and how the fluid affects objects as it flows past. It makes it possible to visualize and analyze fluid flows that range from simple low speed and high speed compressible flows.
Even though CFD allows us to obtain detailed aerodynamic information, an inappropriate model can result in inaccurate or even unphysical results. The parameters of the CFD model and results obtained from CFD simulation have to be always verified and validated with experimental data.
SimFlow
SimFlow is a powerful Computational Fluid Dynamics software available for Windows and Linux. It is based on the OpenFOAM framework and offers an intuitive GUI that helps to choose the correct model by selection of an appropriate solver and a correct boundary conditions.
You may download SimFlow free version from our website: Download SimFlow
Wind Environment Analysis
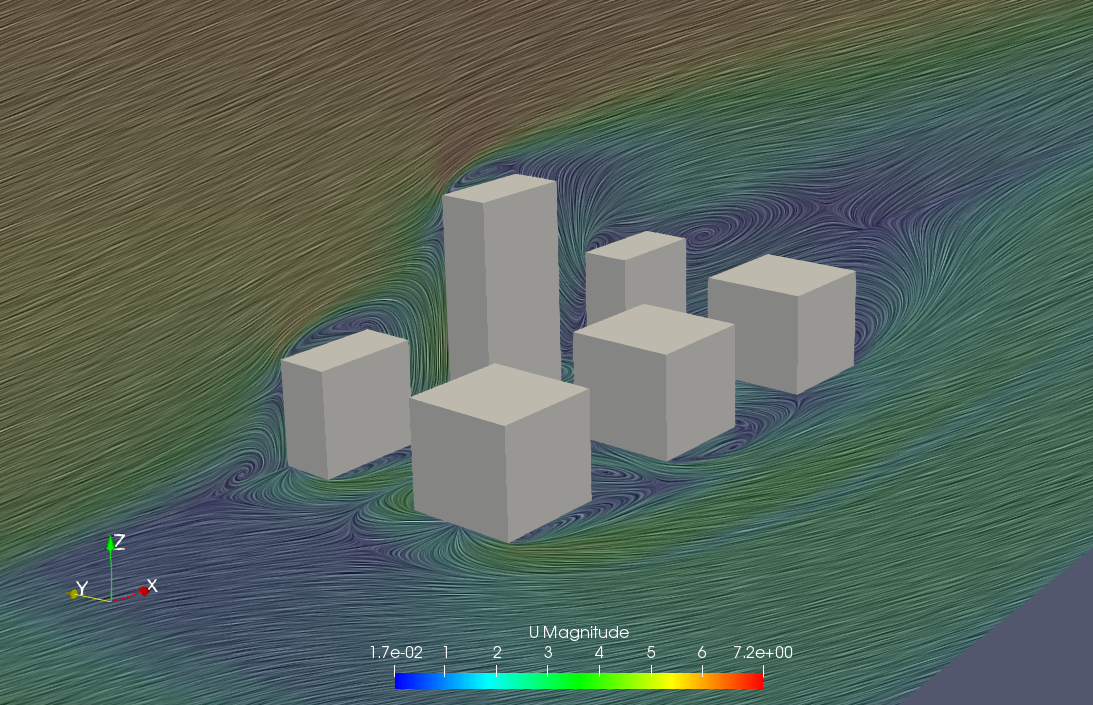
With the development of supercomputers it became possible to perform analysis of problems which require a wide computational domain with complex geometries and a vast number of grids associated with it. Such as the wind environment around high-rise buildings and its surrounding.
Since then CFD has become widely applied to the prediction of the wind environment around high-rise buildings. It has become common practice to perform calculations for wind environments around proposed buildings before its construction begins.
In the wind comfort analysis we are interested in the influence of the wind on pedestrians. Therefore, the pedestrian wind comfort simulation should be able to correctly predict velocity distribution at pedestrian level.
Pedestrian wind comfort analysis requires not only a wide computational domain but also reproduction of the surrounding urban blocks. The mean wind velocity flow profiles and the turbulence quantities at the inlet have a big influence on the accuracy of the results. Therefore, special boundary conditions like Atmospheric Inlet used in SimFlow are designed.
Correctly conducted CFD simulation should provide correct predictions of both velocity and pressure near the ground and buildings.
Architectural Institute of Japan
Founded in 1886, the Architectural Institute of Japan (AIJ) is a non-profit academic association for architects, building engineers and researchers in every field of architecture.
One of the activities of the AIJ is to encourage policies and practices that promote environmental responsibility, awareness and the principles of conservation and sustainable development.
On the basis of those principles AIJ created guidelines for analysis of the pedestrian wind environment around high-rise buildings based on the results of the cross comparison between the results of CFD predictions and wind tunnel tests for seven test cases. The performed work helped to clarify the major factors which are affecting the CFD analysis accuracy.
Guidelines for CFD simulations
The guidelines proposed by both the Working Group of the Architectural Institute of Japan (AIJ) and European Cooperation in the field of Scientific And Technical Research group have become a standard for validation of the accuracy of the CFD codes for pedestrian wind comfort assessments.
The main guidelines can be summarized in few points:
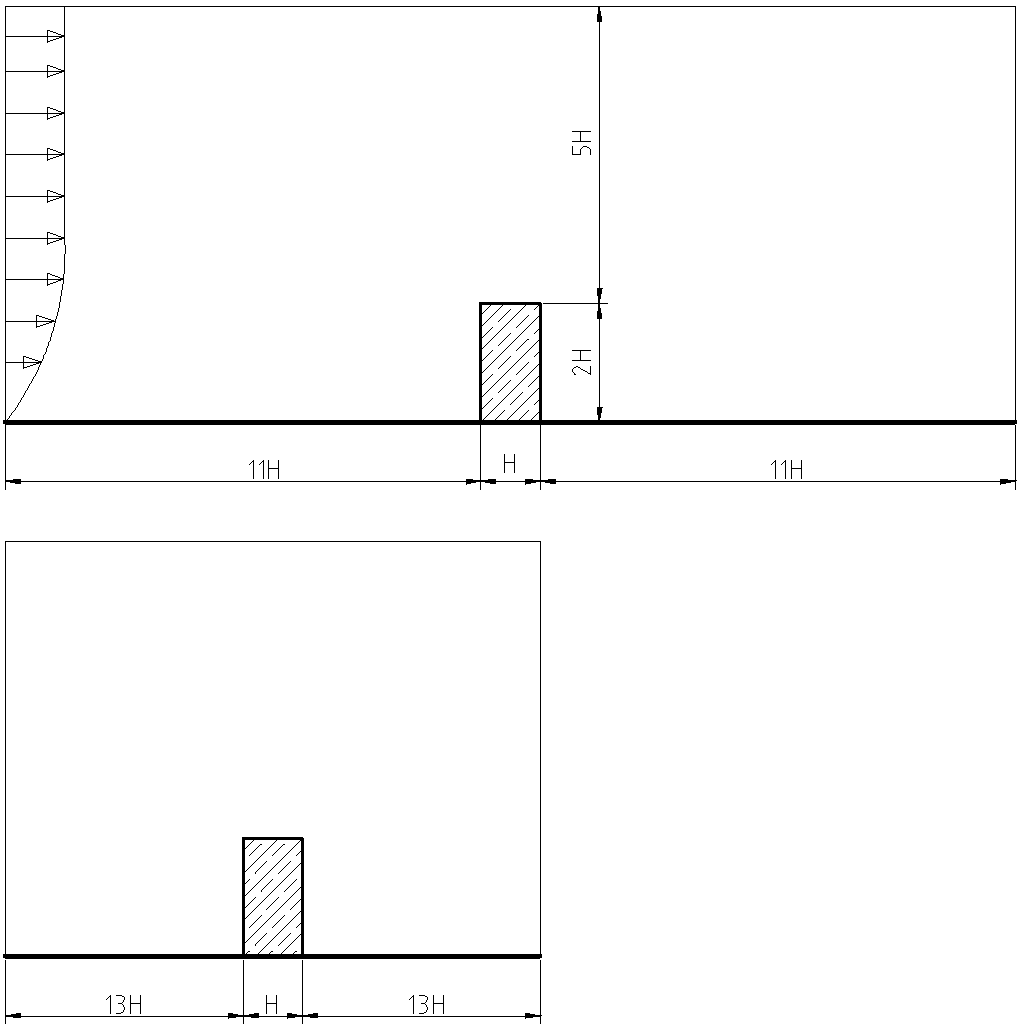
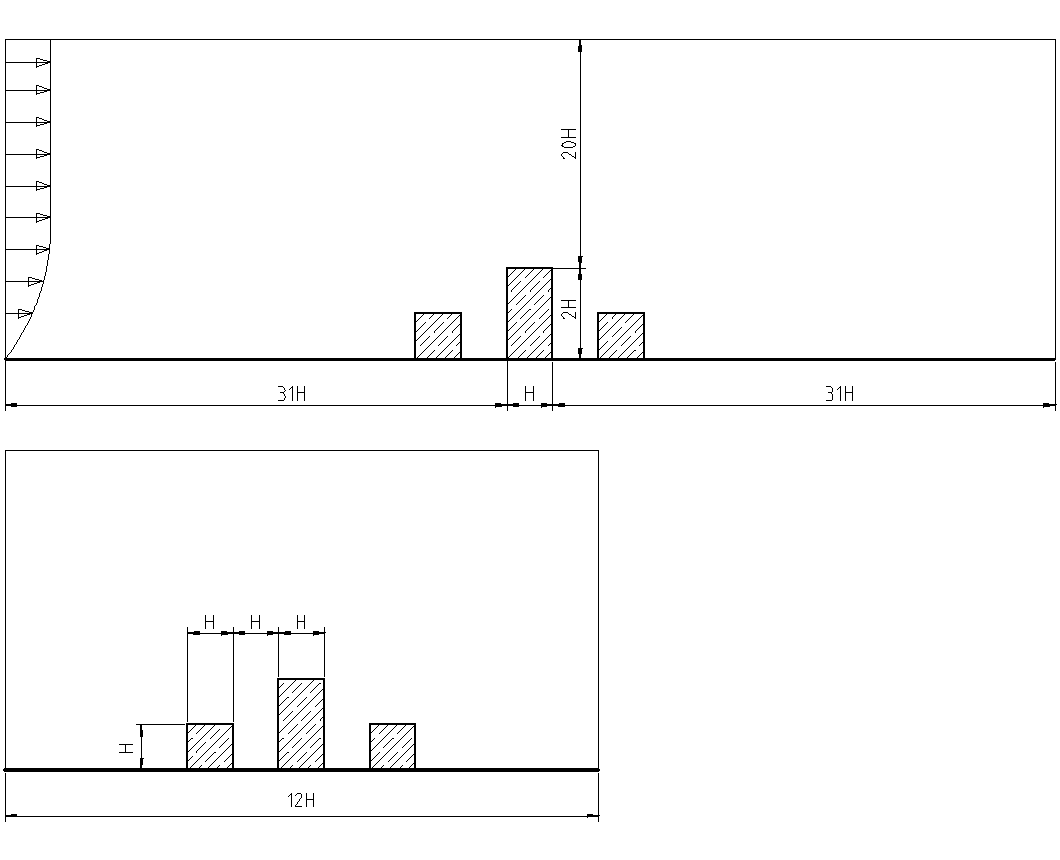
- The recommended top boundary should be set \(5H\) or more away from the building (where \(H\) is the height of the target building)
- The outflow boundary should be set at least \(10H\) behind the building.
- The recommended lateral boundaries are: \(2.3W\) (where \(W\) is the width of built area) and the outflow boundaries \(15H_{max}\) (where \(H_{max}\) is the height of the tallest building) (Franke, 2006)
- For the actual urban area, the buildings in the region to be assessed (generally \(1–2H\) radius from the target building) should be clearly modeled. Moreover, at least one additional street block in each direction around the assessment region should also be clearly reproduced
- It is recommended to use some simplified geometries of a cluster of buildings or to specify appropriate roughness lengths. \(Z_0\) for the ground surface boundary condition to represent the roughness of the outer region.
- For practical reasons \(RANS \; k{-} \varepsilon\) turbulence based models are recommended.
- A fine grid arrangement is required to resolve the flows near the corners to correctly reproduce the characteristics of separating flows near the roof and the walls.
- The minimum of 10 grids is required on one side of a building to reproduce the separation flow around the upwind corners
- The pedestrian wind speeds at \(1.5–2 \; m\) height should be calculated at the third or fourth cell above the ground. The grids should be arranged so that the evaluation height (\(1.5–5.0 \;m\) above ground) is located at the 3rd or higher grid from the ground surface
- For Inlet boundary Atmospheric Inlet should be used in SimFlow. (Appendix A)
- In order to achieve acceptable accuracy, a fine grid arrangement is required near walls and roof where flow separation occurs
- Where possible high order discretization scheme should be used, preferably QUICK discretization scheme
- It should always be confirmed that the prediction result is grid independent.
Additional information can be found in "Guidebook for Practical Applications of CFD to Pedestrian Wind Environment around Buildings", published by AIJ in 2008
CFD Simulations using SimFlow
The experimental results provided by AIJ were used for verification and validation of the results of the SimFlow CFD simulation. Wind tunnel experiments conducted by AIJ were made at models of 1/250 scale, so were the geometric models created for CFD SImFlow simulations. The building was \(H = 0.08 \;m\) square and \(2H = 0.16\;m\) height. A split film probe was used to measure wind velocity, and the average wind velocity in each direction.
To make CFD simulation as close to the experiment as possible the tunnel walls were modeled using following boundary conditions :
- For pressure \(p\) - Zero Gradient
- For velocity \(U\) - No - Slip
- For turbulence model parameters \(k,\; \varepsilon, \; \nu_{\tau}\) - Standard Wall Function
Case A: Pedestrian wind comfort analysis for a single building
The first case being validated is Case A, which is a geometry of one stand alone building were building’s height is double of its width and depth length.
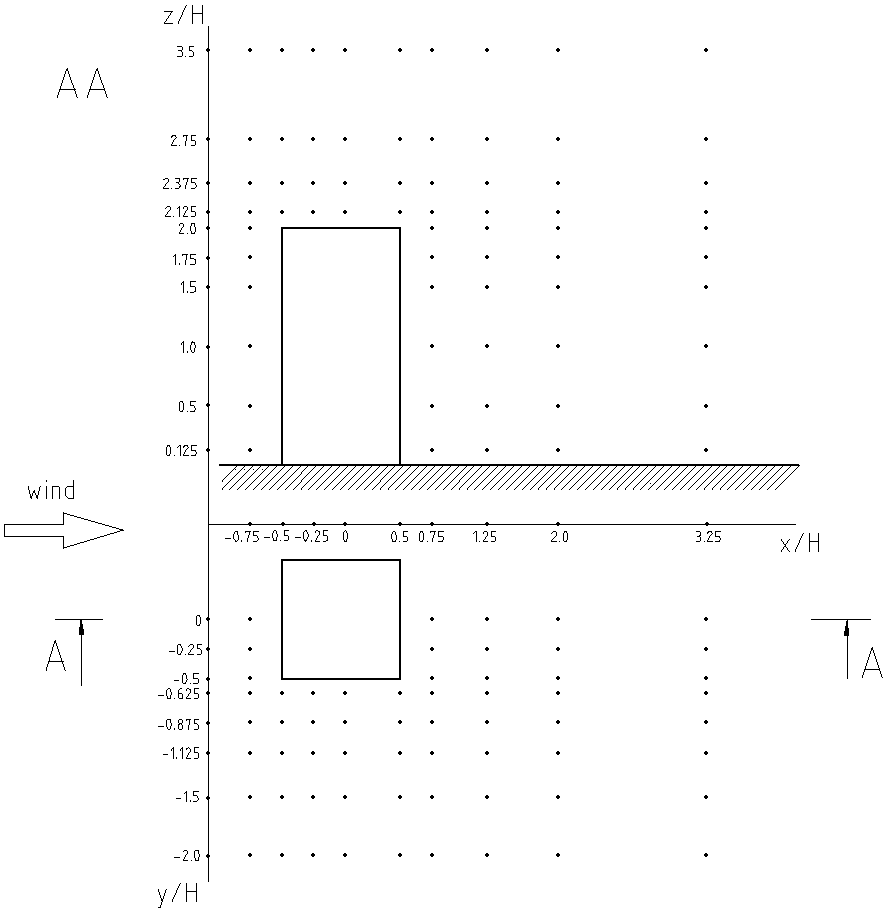
Measuring point were placed in two planes. In vertical cross-section \(y = 0\). And in horizontal plane \(z = 0.125H\) which corresponds to height of 2.5 meters above the ground.
Computational domain
Size of the computational domain for the case A was done according to AIJ guidelines proposed by [Tominaga et al.] Figure 1.
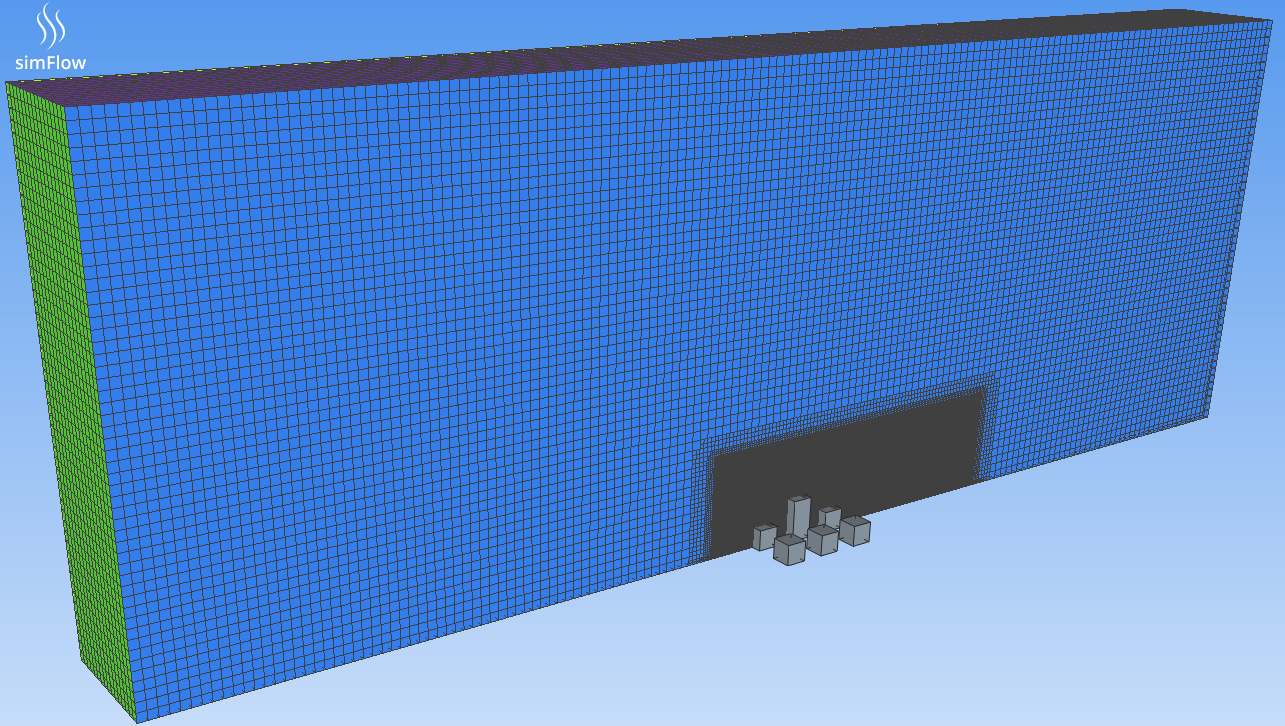
Mesh
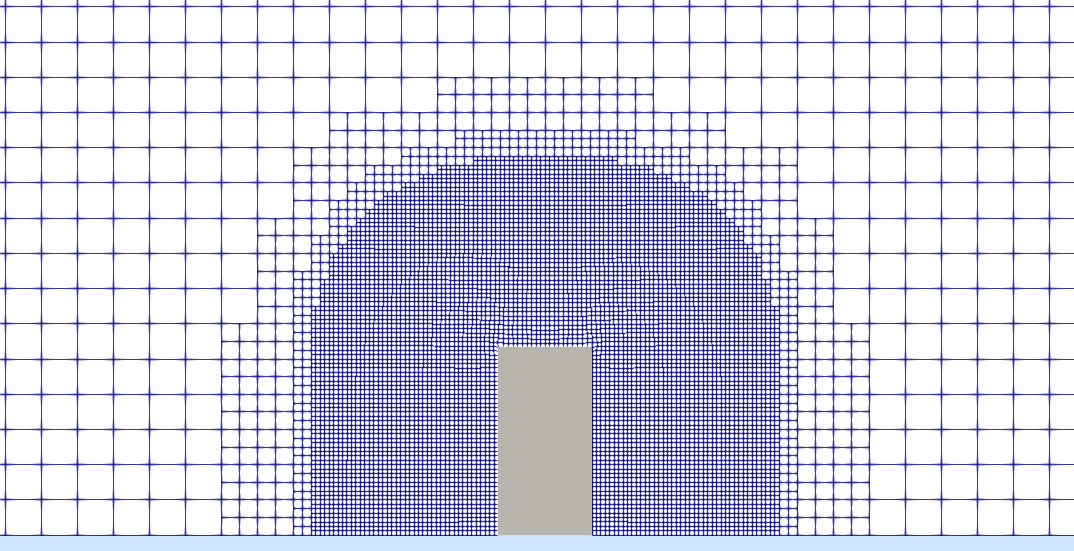
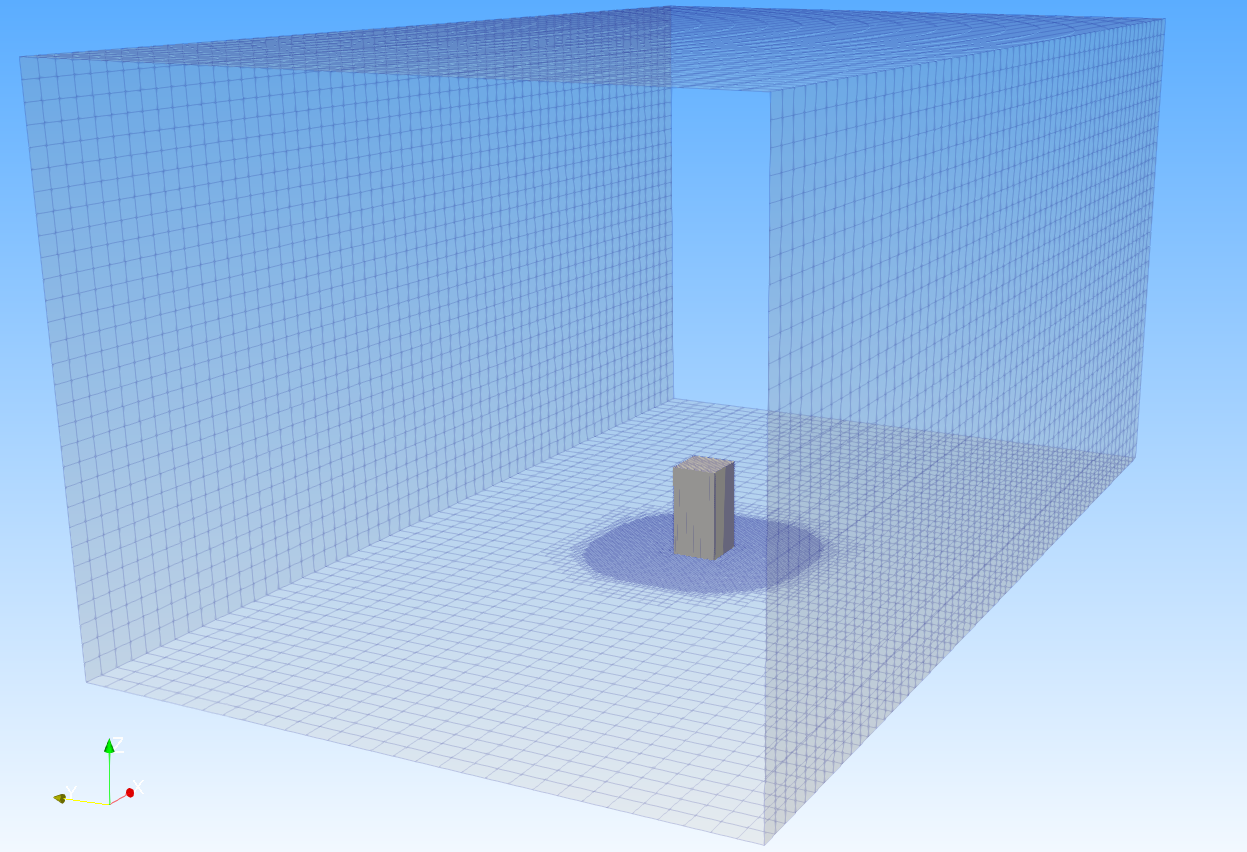
Mesh was created in SimFlow using snappyHexMesh. Geometry was refined with third level Distance Refinement mode in a distance of 0.1633m from the model of the building. It allowed the flow to resolve correctly the flows near the building walls and corners. Created mesh consisted of 641,000 elements.
In order to check whether solution is grid independent additional refinement was applied and did not result in significantly better accuracy.
Simulation setup
For the case an incompressible steady state simpleFoam solver was used. Velocity profile at the inlet to the tunnel was set with the Atmospheric Inlet boundary condition.
The analysis was performed using \(RANS \; k{-} \varepsilon\) turbulence model with Standard Wall Function. The values of \(k\) and \(\varepsilon\) at the inlet were defined by special SimFlow boundary condition Atmospheric Inlet.
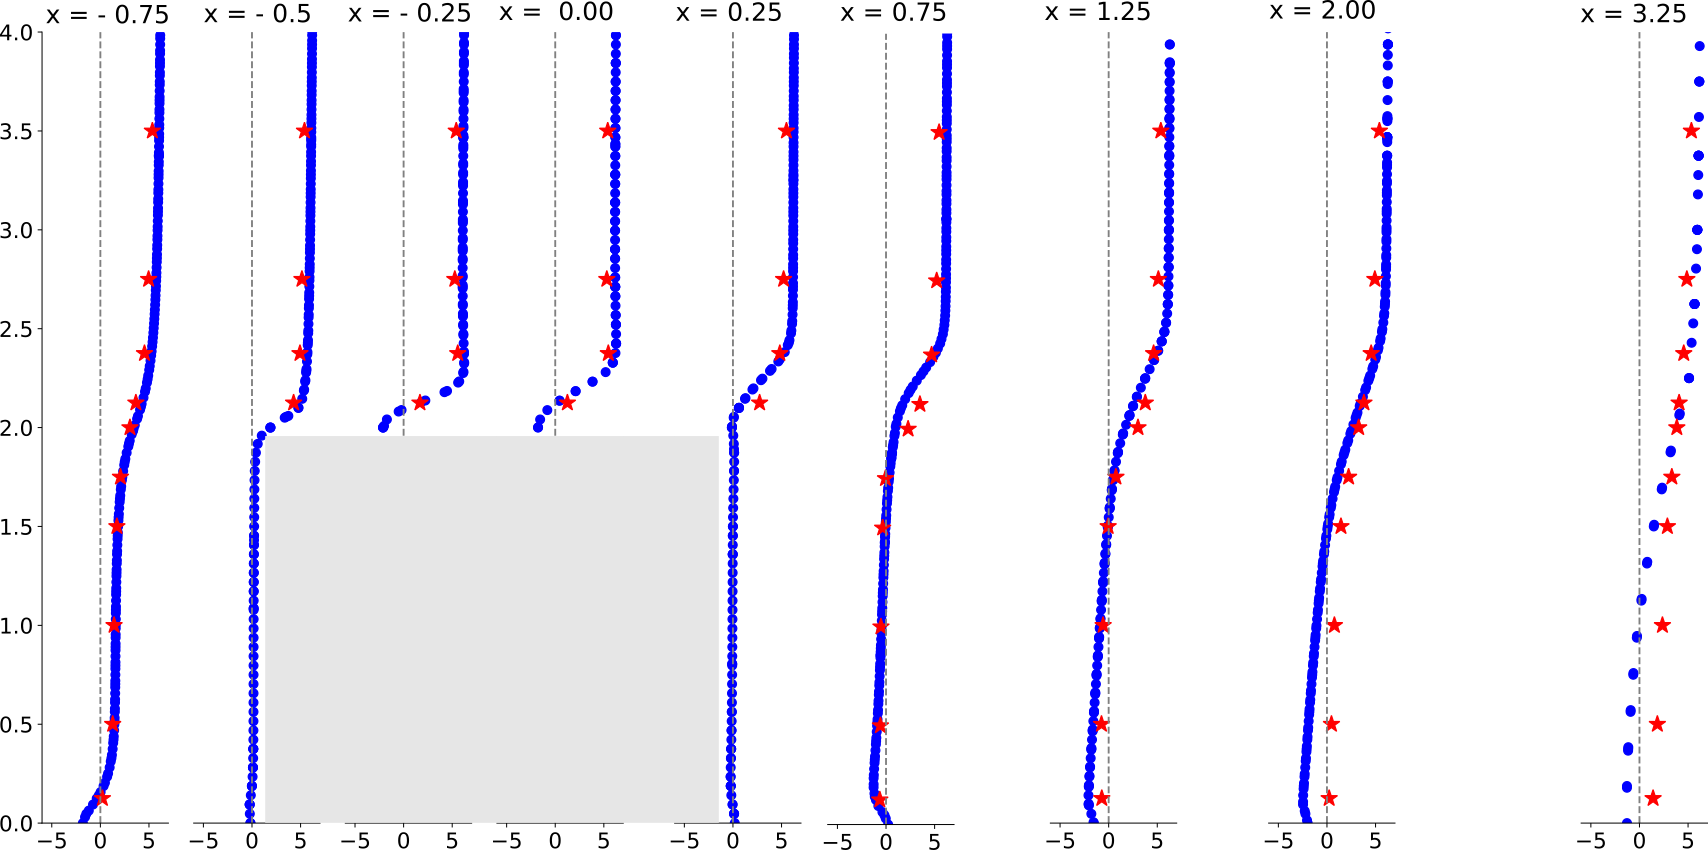
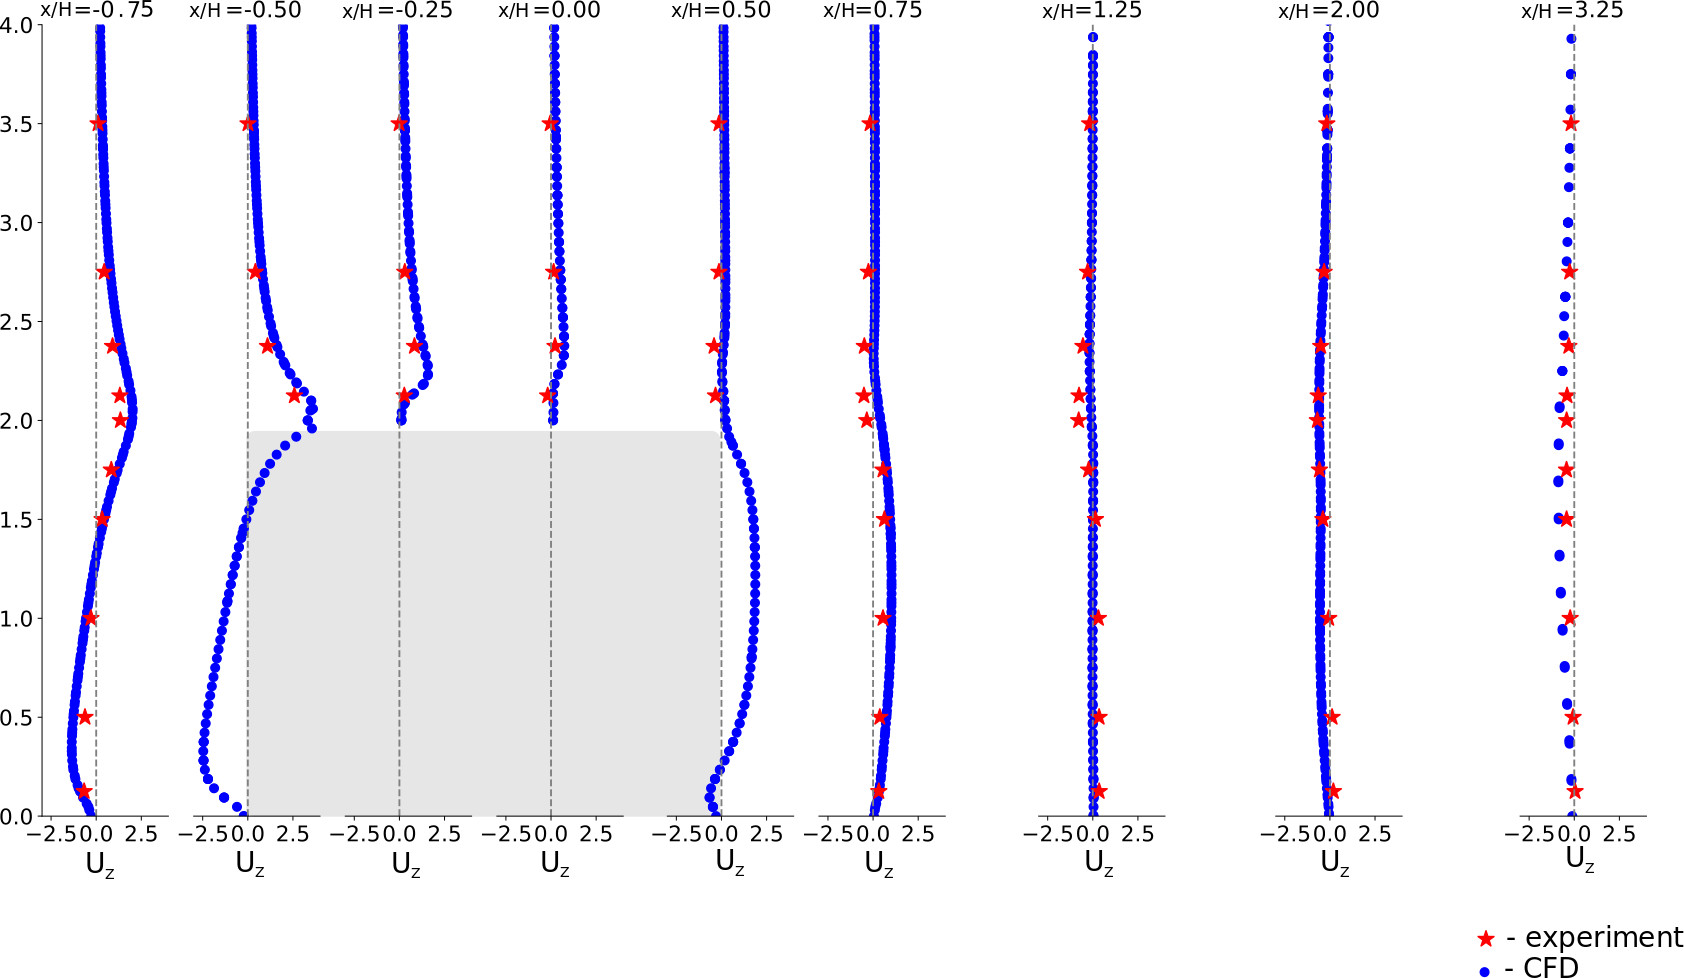
Results
The experimental results by [Meng and Hibi (1998)] were used for verification and validation of the results of the SimFlow CFD simulation (Figure 5 to Figure 8)
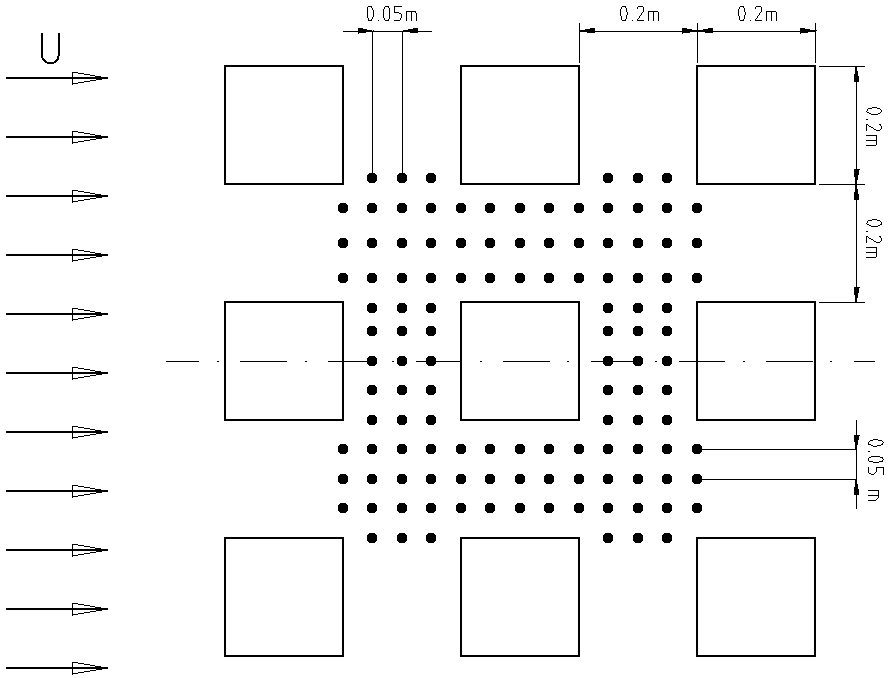
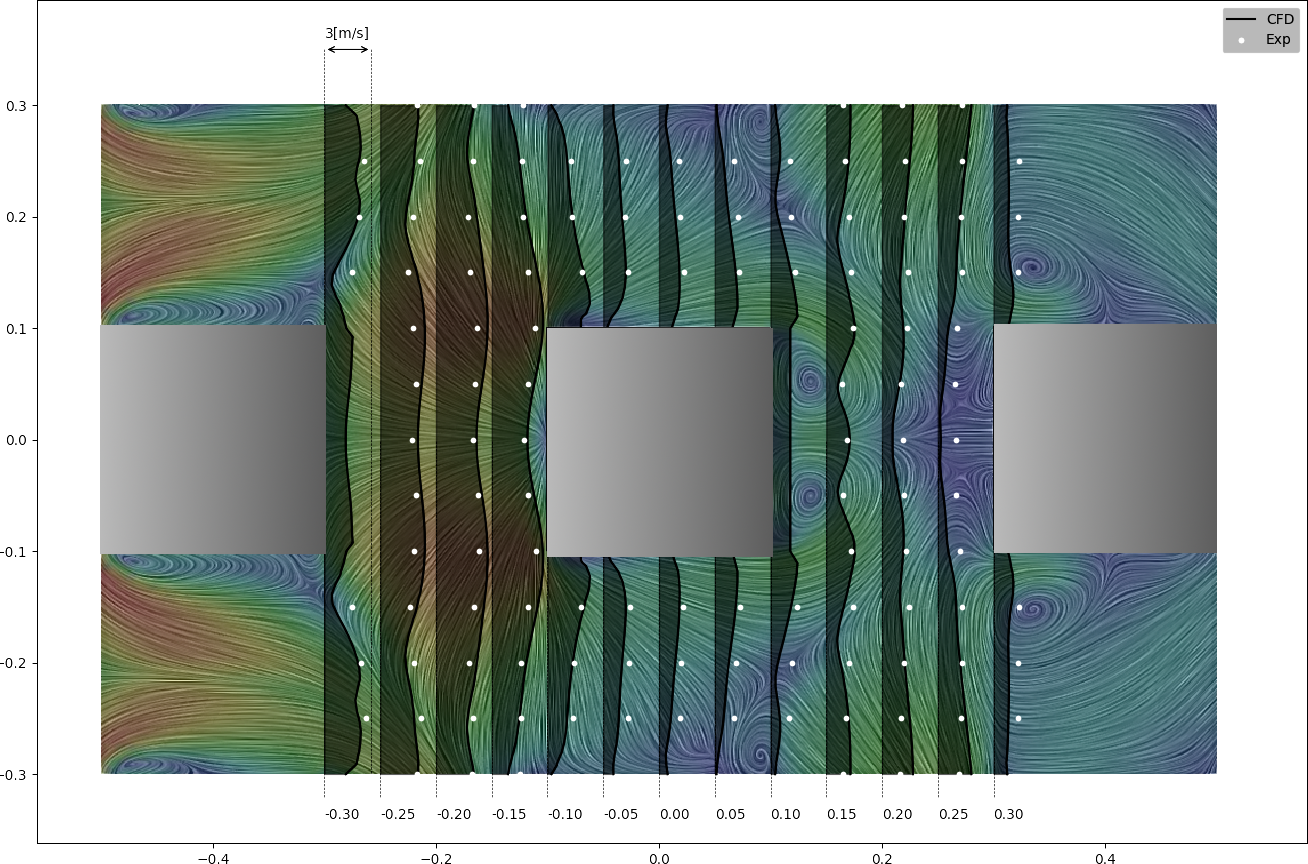
Case C: Pedestrian wind comfort analysis in an Urban Area 2H
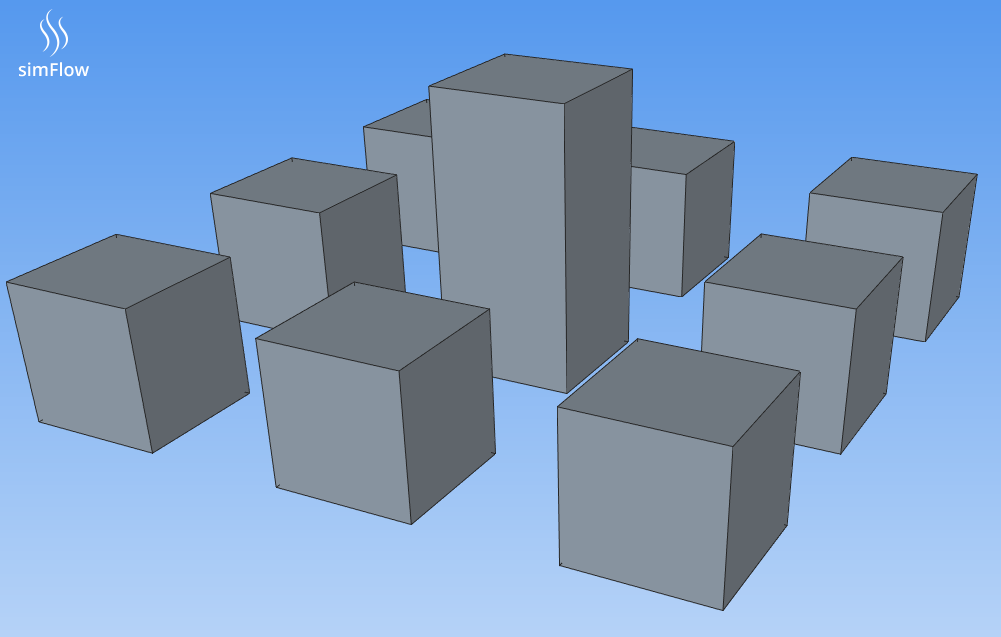
The second case being validated is Case C, which is a geometry of a simple city block where the central building’s height is double of height than the surrounding buildings. Wind tunnel experiments conducted by AIJ were made at models of 1/250 scale, so were the geometric models created for CFD SImFlow simulations. Measuring points were placed at height of 5mm which corresponds to height of 1.5 meters above the ground.
Computational domain
While defining the size of the domain special care should be taken, either too small or too big domain can result in inaccurate results.
Mesh
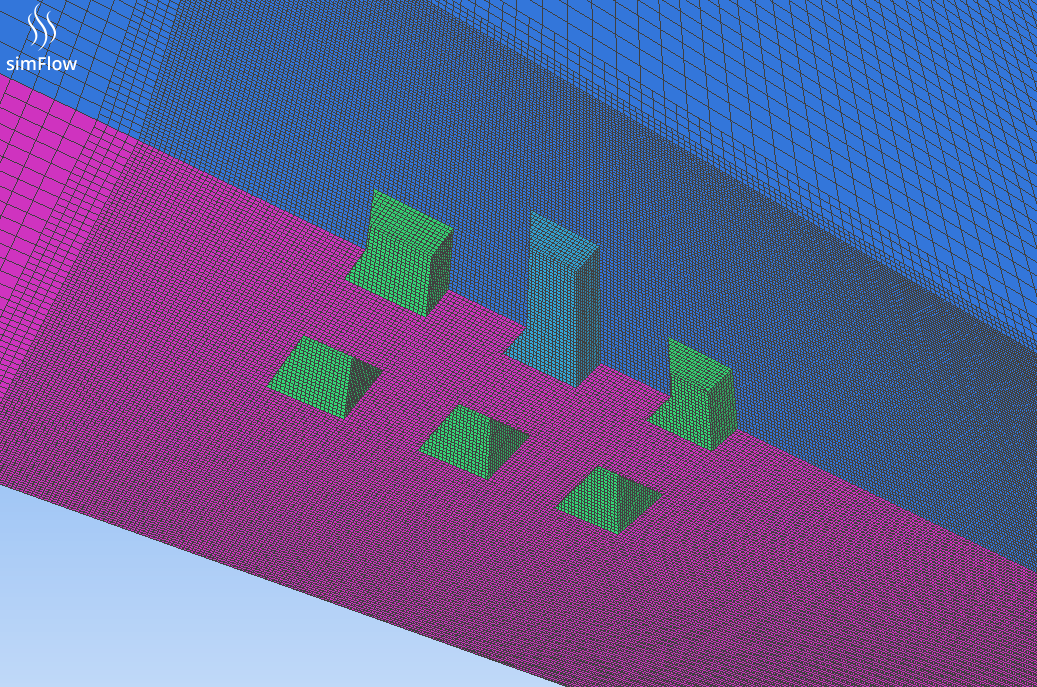
Mesh was created in SimFlow using snappyHexMesh, with additional refinement of the buildings surrounding. Refinement was made to ensure a sufficient amount of cells per building walls and between the buildings was applied.
In order to check whether solution is grid independent additional mesh refinement was applied and did not result in significantly better accuracy.
Simulation setup
For the case an incompressible steady state simpleFoam solver was used. Velocity profile at the inlet to the tunnel was set with the Atmospheric Inlet boundary condition.
The analysis was performed using \(RANS \; k{-} \varepsilon\) turbulence model with Standard Wall Function. The values of \(k\) and \(\varepsilon\) at the inlet were defined by special SimFlow boundary condition Atmospheric Inlet.
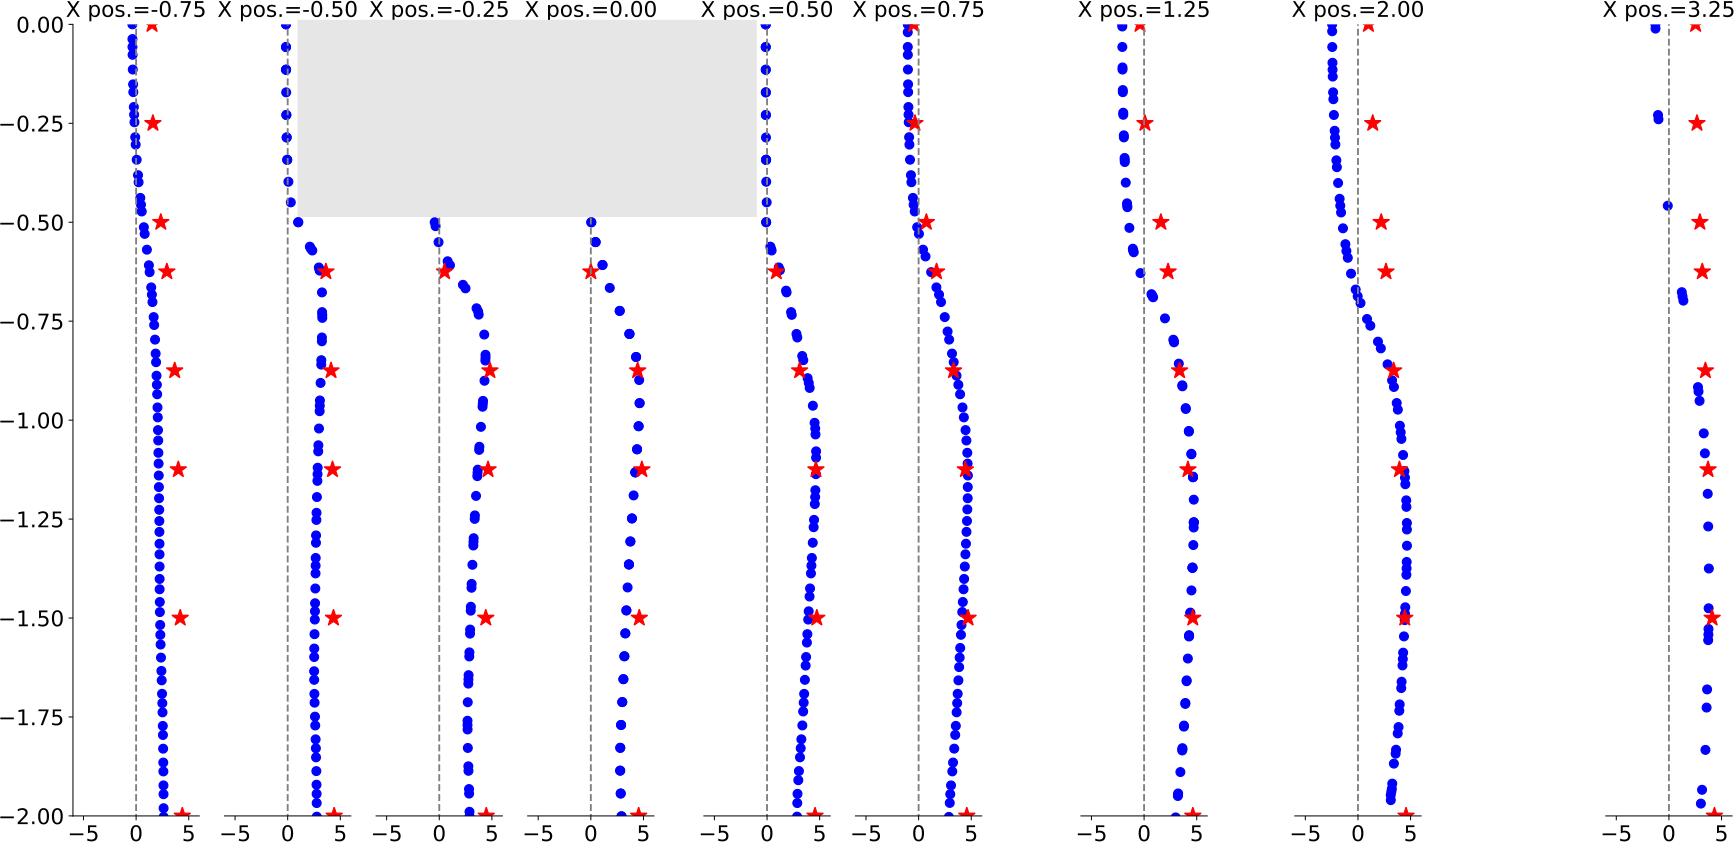
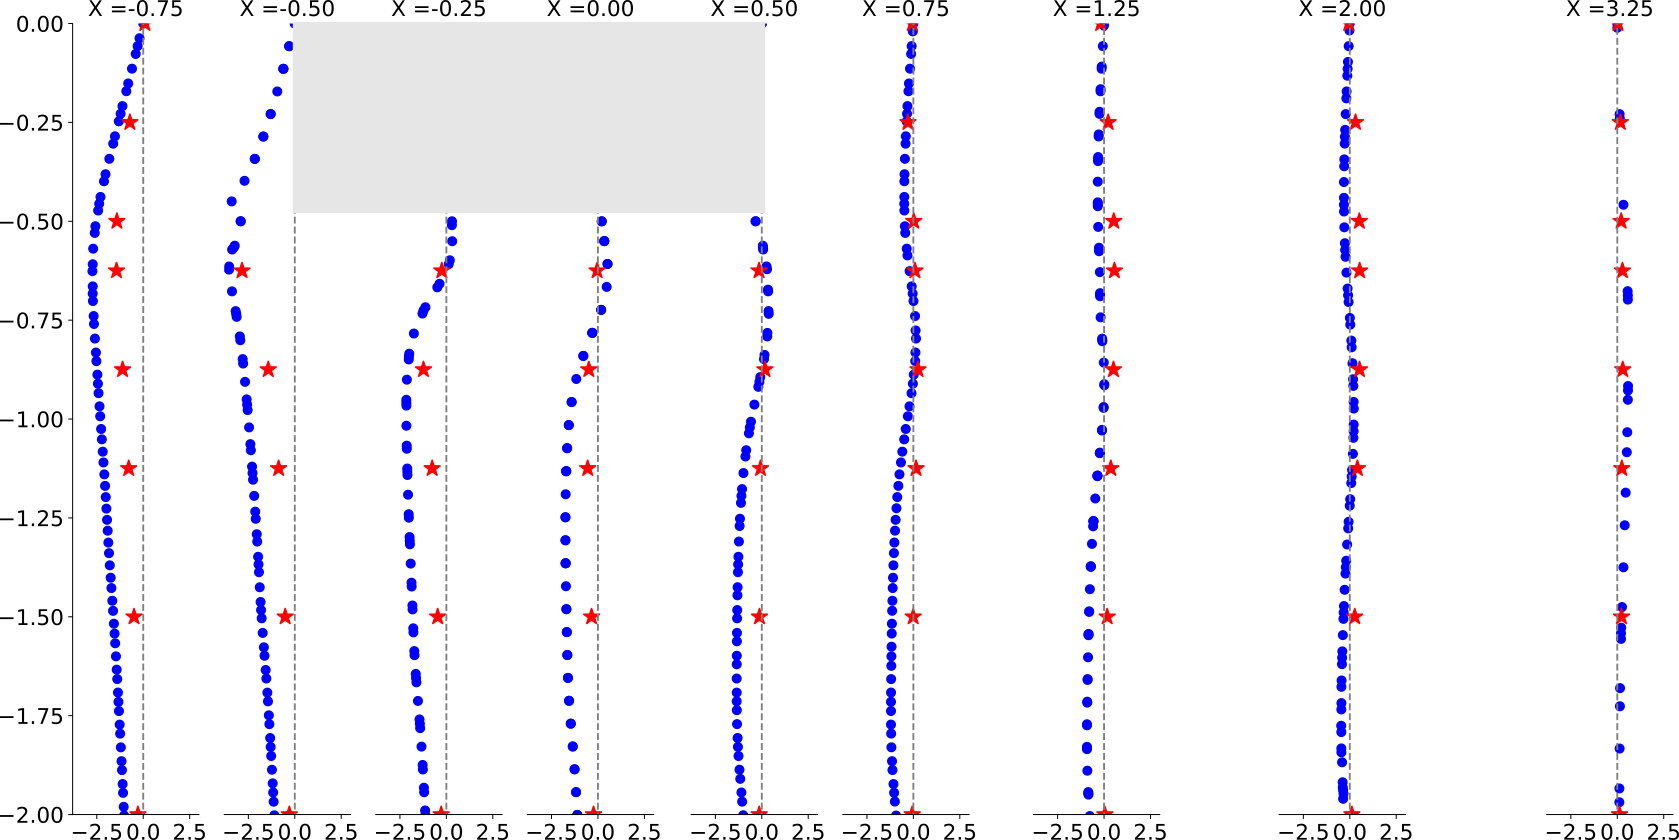
Results
Conclusions
The results of both cases were compared to the experimental data and found to have good correlation. Some underprediction was seen in the \(k{-}\varepsilon\) models in the strong wind regions and underprediction in the wake regions, but is a known trait of the \(k{-}\varepsilon\) model and is within an acceptable range. It should be taken into consideration when evaluating results.
Most buildings are bluff bodies with sharp edges and separating points are always found at the leading edges, regardless of the Re numbers.
Appendix A
The accuracy of the results is highly dependent of the flow profiles of mean wind speed and turbulence quantities that are applied in the inlet plane.
These profiles should be fully developed and representative of the terrain characteristics of the upstream part that is not include in the computational domain.
The velocity profile in the Atmospheric Inlet boundary condition is derived from the friction velocity, flow direction and "vertical" direction:
\(U= \frac{U^*}{\kappa} \cdot ln(\frac{z-z_g+z_0}{z_0})\)
\(k= \frac{(U^*)^2}{\sqrt{C_{\mu}}}\)
\(\epsilon= \frac{(U^*)^3}{\kappa(z-z_g+z_0)}\)
where:
\(U^*\) - Friction velocity
\(\kappa\) - von Karman’s constant
\(C_{\mu}\) - Turbulence viscosity coefficient
\(z\) - Vertical coordinate
\(z_0\) - Surface roughness height [m]
\(z_g\) - Minimum z-coordinate [m]
and
\(U^*=\kappa \frac{U_{ref}}{ln(\frac{Z_{ref}+z_0}{z_0})}\)
where:
\(U_{ref}\) - Reference velocity at \(Z_{ref} \; [m/s]\)
\(Z_{ref}\) - Reference height [m]
Literature
- [Botia-Vera et al.] Yoshie, R., Mochida, A., Tominaga, Y., Kataoka, H., Harimoto, K., Nozu, T., Shirasawa, T., 2005. "Cooperative project for CFD prediction of pedestrian wind environment in the Architectural Institute of Japan. Journal of Wind Engineering and Industrial Aerodynamics", Volume 95, Issues 9-11, October 2007, 1551-1578
- [Meng and Hibi (1998)] Yan MENG Kazuki HIBI "Turbulent measurements of the flow field around a high-rise building J.of Wind Engineering", No.76, July 1998
- [Blocken et al.] Blocken, B., Stathopoulos, T., Carmeliet, J. 2007. CFD "Simulation of the Atmospheric Boundary Layer: Wall Functions Problems."
- [Tominaga et al.] Tominaga, Y., Mochida, A., Yoshie, R., Kataoka, H., Nozu, T., Yoshikawa, M., Shirasawa, T., "AIJ guidelines for practical applications of CFD to pedestrian wind environment around buildings. Journal of Wind Engineering and Industrial Aerodynamics", Volume 96, Issues 10-11, October-November 2008, 1749-1761
- [Hargreaves] D.M. Hargreaves and N.G. Wright, "On the use of the k-epsilon model in commercial CFD software to model the neutral atmospheric boundary layer", Journal of Wind Engineering and Industrial Aerodynamics 95(2007), pp 355-369.